ASSIGNMENT 1:
I. SHORT ANSWERS
GIS involves both spatial and attribute data: spatial data relate to the geometries of spatial features, and attribute data describe the characteristics of the spatial features. Attribute data are stored in tables. An attribute table is organized by row and column. Example of attribute data of a river its name, length and sediment load at gauging station. Examples of spatial data are vectors and raster data.
Since most data, e.g. hard copy maps, is in vector form no data conversion is required. Existing hard copy maps, e.g. sometimes referred to as analogue maps, provide the most popular source for any GIS project. Visual or Analog processing techniques can be applied to hard copy data such as photographs or printouts.
3. What is the difference between “spatial entities” and “continuous fields”? When we use an entity-based approach and a field-based approach. Give examples.
The simplest conceptual model represents geographical space in terms of continuous Cartesian coordinates in 2 or 3 dimensions. The attributes vary smoothly. Most anthropogenic phenomena can be handled using the entity approach. The simplest data model is a basic spatial entity, which is further specified by attributes and geographic location. This can be further subdivided according to geographical data primitives: “a point”, “a line”, and “a polygon”.
With continuous field data the variation is too complex. It is necessary to divide geographical space into discrete spatial units. The resulting tessellation is taken as a reasonable approximation of reality. Both models assume that the phenomena can be specified exactly in terms of both their attributes & spatial position.
Examples of each are vector view and raster view.
2) Grids are good only at very localized topology, and weak otherwise.
3) Grids are a natural for scanned or remotely sensed data.
4) Grids suffer from the mixed pixel problem.
5) Grids most often include redundant or missing data
5. Describe how would you create a new ArcGIS layer of the rivers (rivers.lyr), that go through three states: Virginia, Maryland and Pennsylvania?
1) Add data for US Database
2) Add Layers - states and rivers
3) Identify the three states to find out the rivers that flow through them – Potomac, Susquehanna rivers.
2) Add Layer for cities.
3) Customize colors for population density in layer properties
- Explain the difference between attribute data and spatial data and give an example of each. Do we need to input both data to GIS? Explain your answer
GIS involves both spatial and attribute data: spatial data relate to the geometries of spatial features, and attribute data describe the characteristics of the spatial features. Attribute data are stored in tables. An attribute table is organized by row and column. Example of attribute data of a river its name, length and sediment load at gauging station. Examples of spatial data are vectors and raster data.
- Even with the increasing availability of digital sources, why might one still consider tracing from paper sources for a GIS project?
Since most data, e.g. hard copy maps, is in vector form no data conversion is required. Existing hard copy maps, e.g. sometimes referred to as analogue maps, provide the most popular source for any GIS project. Visual or Analog processing techniques can be applied to hard copy data such as photographs or printouts.
3. What is the difference between “spatial entities” and “continuous fields”? When we use an entity-based approach and a field-based approach. Give examples.
The simplest conceptual model represents geographical space in terms of continuous Cartesian coordinates in 2 or 3 dimensions. The attributes vary smoothly. Most anthropogenic phenomena can be handled using the entity approach. The simplest data model is a basic spatial entity, which is further specified by attributes and geographic location. This can be further subdivided according to geographical data primitives: “a point”, “a line”, and “a polygon”.
With continuous field data the variation is too complex. It is necessary to divide geographical space into discrete spatial units. The resulting tessellation is taken as a reasonable approximation of reality. Both models assume that the phenomena can be specified exactly in terms of both their attributes & spatial position.
Examples of each are vector view and raster view.
- Name four DISADVANTAGES of raster data structure (name more for extra points)
2) Grids are good only at very localized topology, and weak otherwise.
3) Grids are a natural for scanned or remotely sensed data.
4) Grids suffer from the mixed pixel problem.
5) Grids most often include redundant or missing data
5. Describe how would you create a new ArcGIS layer of the rivers (rivers.lyr), that go through three states: Virginia, Maryland and Pennsylvania?
1) Add data for US Database
2) Add Layers - states and rivers
3) Identify the three states to find out the rivers that flow through them – Potomac, Susquehanna rivers.
- Describe the steps in reclassifying the generic map of Virginia to the map of population. What steps do you need to do? What layers/data do you need for this?
2) Add Layer for cities.
3) Customize colors for population density in layer properties

|

|
II. MULTIPLE-CHOICE QUESTIONSCheck or circle the correct answer.
III. TRUE AND FALSE QUESTIONS
Mark with T=True or F=False the following statements
1. Today success or failure with GIS depends more on technology, but not on the conceptual models of space
TRUE FALSE
2. GIS analyst spends much more time on creation than on verification a model
TRUE FALSE
3. In a GIS attribute information and spatial information are linked to each other
TRUE FALSE
4. Spatial environmental surface analysis and modeling is easy with CAD systems
TRUE FALSE
5. When you select the spatial feature on a map in ArcGIS, the attribute information about the same feature has to be found and selected separately
TRUE FALSE
- In the World of GIS, another term for the spatial feature (object) is:
- Entity
- Topology
- Attribute
- Raster Grids
- Which of the following is the example of non-spatial data?
- The number of rooms in an office building
- The path of a highway between two cities
- The vegetation patterns
- The location of supermarkets in Fairfax, VA
- Which of the following are NOT the advantages of vector data structure?
- Compact data structure
- Accurate graphic representation
- Overlay analysis is easy
- Network analysis is easy
III. TRUE AND FALSE QUESTIONS
Mark with T=True or F=False the following statements
1. Today success or failure with GIS depends more on technology, but not on the conceptual models of space
TRUE FALSE
2. GIS analyst spends much more time on creation than on verification a model
TRUE FALSE
3. In a GIS attribute information and spatial information are linked to each other
TRUE FALSE
4. Spatial environmental surface analysis and modeling is easy with CAD systems
TRUE FALSE
5. When you select the spatial feature on a map in ArcGIS, the attribute information about the same feature has to be found and selected separately
TRUE FALSE
ASSIGNMENT 2:
PRACTICAL APPLICATION
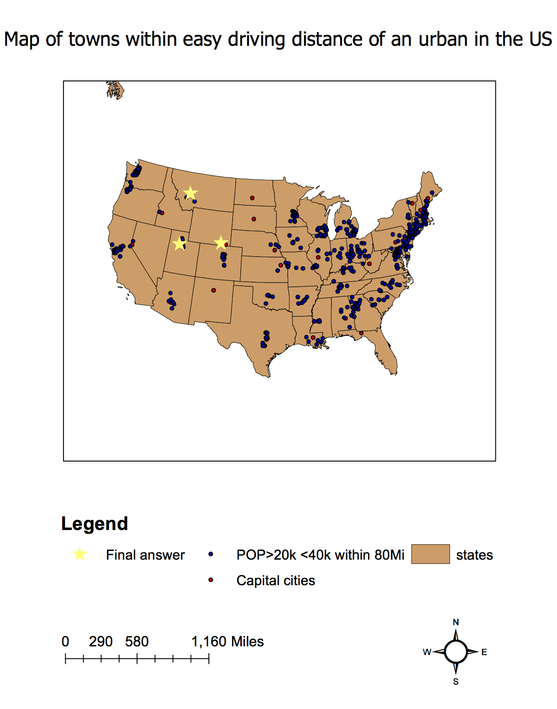
RATIONALE: Imagine that you are looking for a nice place to live in the US. You like being in a small town in a fairly rural area, but within easy driving distance of an urban area for fun.
You would prefer a city between 20,000 and 40,000 people, no more than 80 miles from a capital city, in a county with a population density of less than 25 persons per square mile.
List the names and states of these cities in the U.S. that meet all these criteria.